Problem 1.2 Cumulative Temperatures
As a data analyst for an environmental research company, you need to identify periods of high temperatures from sensor data collected over time. Your task is to find the contiguous stretch of recorded temperature values that has the highest cumulative temperature. The data includes both positive and negative values, indicating hot and cold tempteratures respectively. By identifying the period with the maximum sum overall, you will be highlighting a stretch of overall warm weather for further analysis of temperature fluctuations.
The problem, then, is this: Given a sequence of temperature readings, determine the start and end indices (which represent start and end time values) of the period that yields the maximum cumulative termperature, as well as report the maximum cumulative value itself.
Examples of inputs and outputs:
Some example inputs and their corresponding outputs are shown below, first in textual and then visual format.-
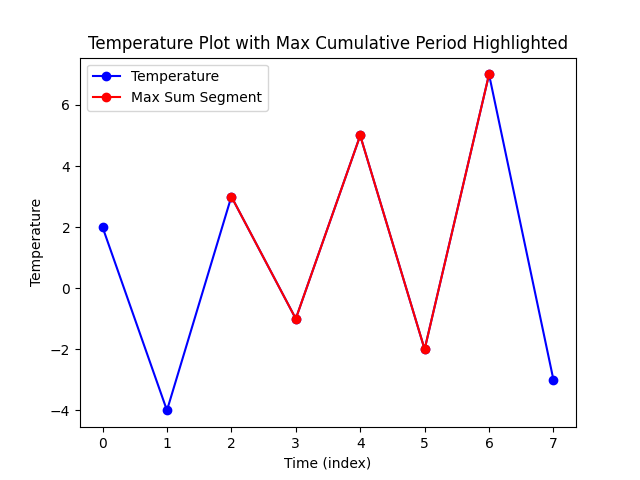
Input: temperatures = [2, -4, 3, -1, 5, -2, 7, -3]
Output: start index = 2, end index = 6, cumulative temperature = 12
Explanation: The period with the maximum cumulative sum is [3, -1, 5, -2, 7], starting at index 2 and ending at index 6. Hence, the maximum cumulative value is 12.
-
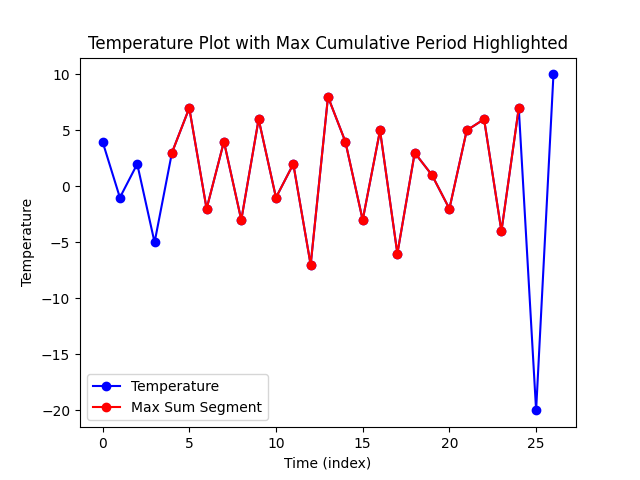
Input: temperatures = [4, -1, 2, -5, 3, 7, -2, 4, -3, 6, -1, 2, -7, 8, 4, -3, 5, -6, 3, 1, -2, 5, 6, -4, 7, -20, 10]
Output: start index = 4, end index = 24, cumulative temperature= 33
Explanation: The period with the maximum cumulative sum is [3, 7, -2, 4, -3, 6, -1, 2, -7, 8, 4, -3, 5, -6, 3, 1, -2, 5, 6, -4, 7], starting at index 4 and ending at index 24. Hence, the maximum cumulative value is 33.
Fiigure 1 below shows the maximum culmulative tempertature segments for the above examples in red
Python code
Implement the following function stub:
Use the following main to test your function: