Problem 3.3 Stock Analysis by First Rises
While computing the maximum rise in a stock price is useful for analysis, it does not accurately capture the pattern of price rises. A single rise in value could be an outlier.
A better way to capture the pattern of price rises is to compute, for each price point, the first subsequent rise in its value. Once these rises have been computed for each price point, further analysis can be performed to study the stock behavior more thoroughly.
The problem: For each price of the stock, we compute the first rise in its value; i.e., for each \( i \), we compute first_rise[i] = prices[j] - prices[i], where \( j \) is the first index after \( i \) for which prices[j] > prices[i].
If no such \( j \) exists for an \( i \), then first_rise[i] = -1. Consequently, first_rise[n-1] = -1 (where \( n \) is the length of the input).
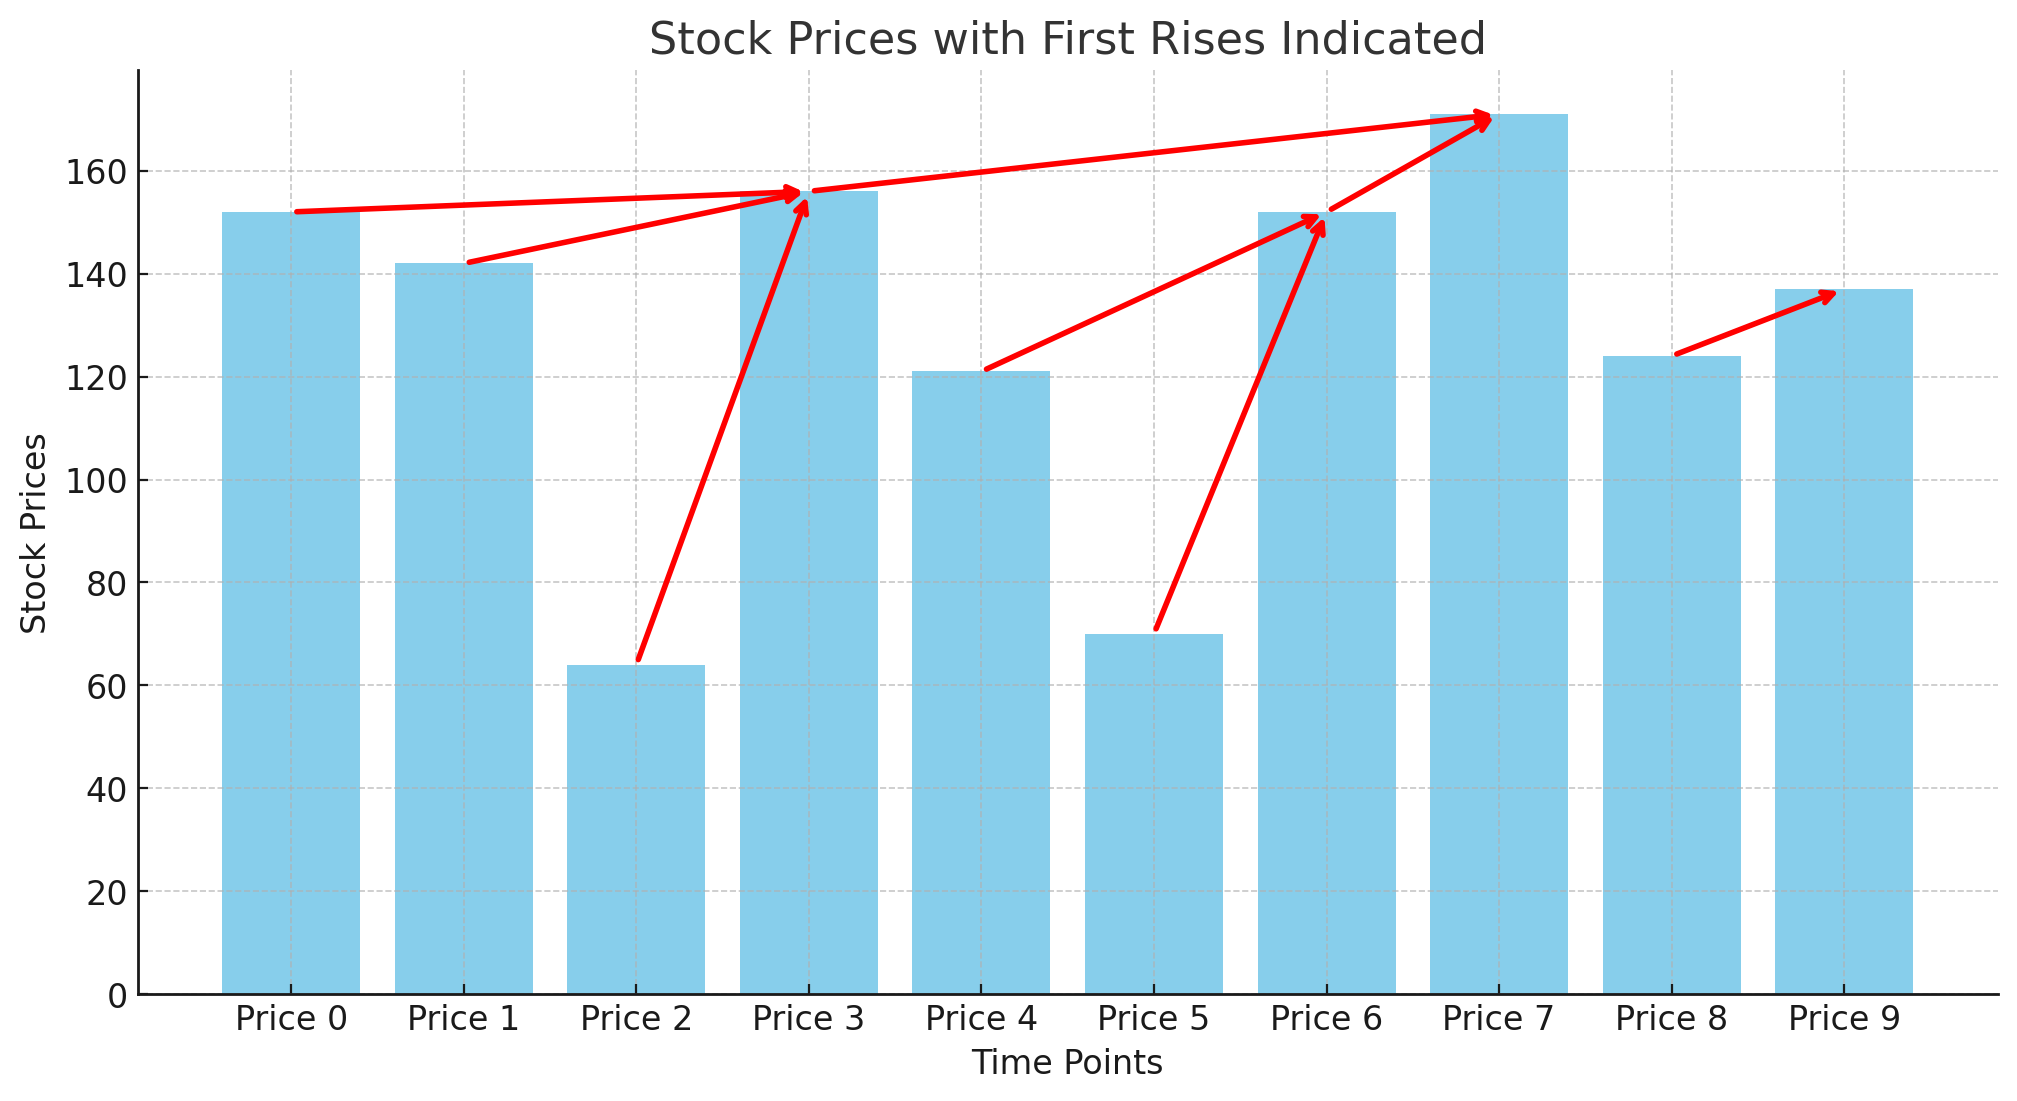
Firgure 1 below shows a plot of price values and the first rises in their values (the red arrows).
Code
The simple method to compute all first rises checks for each point \( i \), the points \( j > i \) corresponding to the first increase in price value after \( i \). As a warm-up, implement the following function stub using this straightforward approach. However, try not to be wasteful during the process; specifically, as soon the first rise is found for a price point there is no need to look at the subsequent prices.
Test your code
Use the following main to test your function:
A better approach (back to Balanced Brackets)
A better method is based on the following observations:
- For any price point \( j-1 \) ( \( j > 0 \) ), the next point \( j \) such that
prices[j] > prices[j-1]is the required point forfirst_rise[j-1]. - More generally, the same price point \( j \) is also the required point for all previous prices
prices[j-k], where \( k = 1, 2, 3, ... \), as long asprices[j-k] < prices[j].
The stack-based solution for this problem is mappable (with small alterations) to the Balanced Brackets problem.
Consider the following comparison:
- Push the first price point (0) into the stack (as if it as an "opening bracket").
- For each price point \( i \) after 0:
- If the price at \( i \) is less than or equal to the price at the top of the stack, it is pushed into the stack like an "opening bracket".
- Else, if the price at \( i \) is greater than the one at the top of the stack, it is like a "closing bracket". In this case, we pop all the price points with values less than this price and mark their rise values in first_rise.
- Lastly, for the price points left in the stack after the input scan is complete, mark their rises as -1 (as no higher prices, or "closing brackets", were found for them).
Implement the first_rises function using the refined approach. Use the same main as above to test your code.